Sunday, July 7, 2013

How to do Report in Tableau


Sample Report:  We can do the report by doing simple drag and drops in Tableau
 
Here we are doing a report for Region wise sales
Step I : Open Tableau  and drag and drop the fields into Columns and rows
Step 2 : Add the filters
Step3 : Add Colors, Size and Labels
 
Step I : Adding fields into Columns and rows
Drag and drop Region from Dimensions into Columns and Sales from Measures into
 Rows
 
Step II : Adding Region filter for this report
1.       Drag and drop Region Column into Filters and it will display the below screen


2.       Select all from the list and Click Ok then the region will add in to the filters as shown in the below screen

3.       Click on Show Quick Filters then the filters will be available in the right side of the screen
Step III :
1.       Apply Color for Region wise :Drag and drop Region from Dimensions into Color then it will apply the Color for Region wise 

2.       Apply Labels on Sales : Drag and drop Sales from Measures into Label then it will display the Sales values (ie., Sales value)


Thursday, July 4, 2013

How to use our Excel file as source in Tableau


Step I : Select the Excel file
Step II : Give the Excel workbook Connections

Step III : Select the Data connection type

Step I : Go to Connection tab and click Microsoft Excel then select your Excel file.

 
Step II : Once we selected Excel file then it will ask below details
one work sheet is nothing but one table

1. Select the Worksheets to analyze (Single Worksheet or  Multiple Worksheets or Custom SQL).
2. Select the option as "Yes, the first row has field names in it" if our sheet, first row having field name.
3. Give the connection name for use in tableau.

Then Click OK
Step III : Select the Data Connection
1.  Connect live : It wil directly connect to your live Data
2.  Import all Data : Import your data in to Tableau's fast data engine
3.  Import some Data : Select the subset of your data to import in to Tableau's fast data
 engine
 
by clicking "Import some Data" We can restrict the Data by using Filters
Here we are selecting Import all Data option

It is imported all data into Tableau’s fast data engine then in left side pane we can able to see all the measures and dimensions.


Now we can do the reports with different visualization using Dimensions and Measures
 

Tuesday, July 2, 2013

Tableau Learning


Tableau  Main icons
1.    Click on the below highlighted icon that will take you to the home page
Home Page look like in the below screen 
 
2.     Tableau will support different Data Sources like flat files (Text files, Workbooks, Excel, Access, Tableau Extract(TDE) files ) and servers (Database, Hadoop, DB2, Oracle, Amazon, MYSQL, Big Data, SAP, Tera Data, ….etc)
Click on the below highlighted  icon in the Tableau then we will able to see what the data sources it will support.
3.        Below highlighted icon will show the sheets and dashboard details in a book
Here we are having 2 sheets and 1 dashboard in the below screen    
 
4.       Click on Below highlighted icon
 
The above highlighted icon will take you to the work space area to do the reports. In left side pane it will show the Dimensions and facts which is available in the Tableau
 
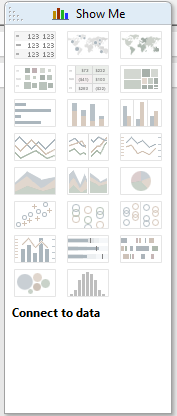
Using Tableau we can do the reports with 23 different type of visualizations like Heat maps, Filled maps, Symbol maps, Tree maps, Horizontal bars, Stacked Bars, …… etc